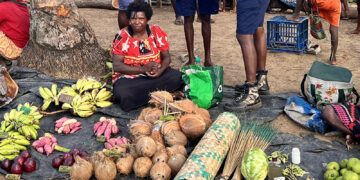
November 4, 2024 November 4-9, 2024 The International Food Policy Research Institute (IFPRI) and the Fresh Produce Development Agency (FPDA), in collaboration with the Western Province Partnership program of Abt Associates, recently conducted an intensive six-day training program on food price data collection from Nov 4-9,2024, in Daru town, South Fly district, Western Province. Seven […]
Agricultural Policy Analysis using Partial Equilibrium Models
This workshop equips participants with the skills to evaluate simulated effects of diverse shocks on the agriculture sector of Papua New Guinea. In addition to learning the basics of partial equilibrium models, participants will also learn about economy-wide modeling and social accounting matrices. By the end of the training, participants will be able to identify […]
Evidence-based trade policymaking and analysis: Trade and trade-policy indicators
This training provides participants with the skills needed to use and analyze trade flow data to understand the economic benefits that countries gain from trade. Participants will learn the importance of using trade flow data, including BACI (Base pour l'Analyse du Commerce International) for informed decision-making related to trade policies. By the end of the […]
Introduction to Geographic Information Systems (GIS) & Mapping Agriculture System
This workshop provides a foundational understanding of GIS principles, concepts, and technologies. Participants will learn to use the Geographic Information Systems software to map various socio-economic and biophysical characteristics of Papua New Guinea. The training includes the use of roads, schools, health centers, demographic data and agricultural system data. Date: May 15 – 25, 2023 […]
Training on KoBoToolbox for Data Collection & Introduction to Data Analysis Using Stata
Participants will learn how to design, implement, and manage data collection using Kobo Toolbox (A free open-source software used for developing, storing, managing, and sharing forms and collected data). In addition, participants will learn how to download / export survey data from the Kobo Toolbox server via different formats and import the data to Stata […]


