Sort by:
Latest
|
Year
|
Title
|
Type
Type
Themes
Regions/Countries
Year
Language
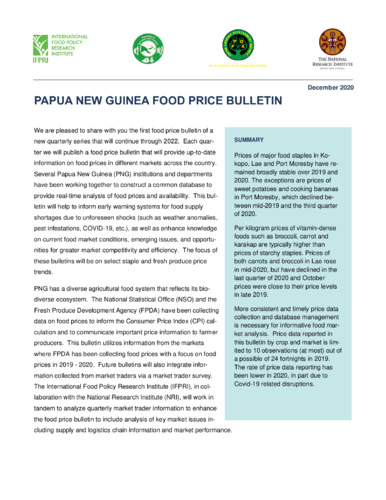
Papua New Guinea food price bulletin: April 2024
International Food Policy Research Institute. 2024
Abstract | Link
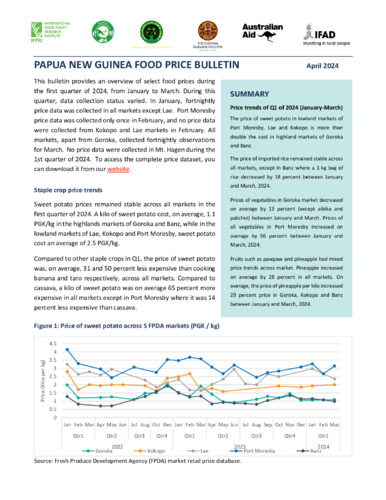
This bulletin provides an overview of select food prices during the second quarter of 2024, from April to June. During this quarter, two rounds of data were collected per month across all markets, except for Goroka in April and Lae in May, where only one round of data was collected. The prices presented here are the monthly averages. The graphs in this bulletin show price changes within the second quarter and compare second quarter prices with the first quarter of 2024, between January and March. To access the complete food price dataset, please download it from our website.
Papua New Guinea food price bulletin: July 2024
International Food Policy Research Institute. 2024
Abstract | Link
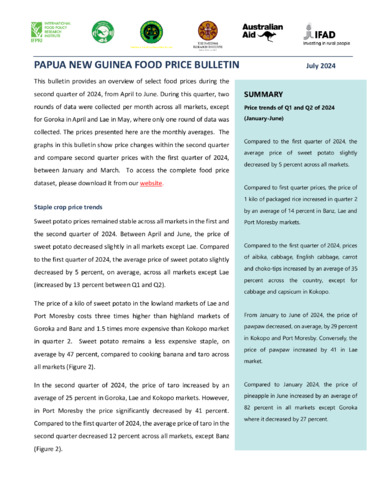
This bulletin provides an overview of select food prices during the second quarter of 2024, from April to June. During this quarter, two rounds of data were collected per month across all markets, except for Goroka in April and Lae in May, where only one round of data was collected. The prices presented here are the monthly averages. The graphs in this bulletin show price changes within the second quarter and compare second quarter prices with the first quarter of 2024, between January and March. To access the complete food price dataset, please download it from our website.
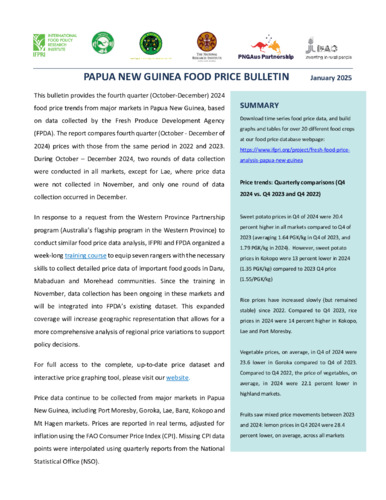
Papua New Guinea food price bulletin: January 2024
International Food Policy Research Institute. 2024
Abstract | Link
This bulletin presents food price trends during the fourth quarter of 2023 and compares current prices with those of previous years (2021-2022) from major markets across Papua New Guinea using data collected by Fresh Produce Development Agency (FPD). It is important to note that during the fourth quarter of 2023, none of the markets had a complete set of fortnightly price data. While Port Moresby had fortnightly observations for October and December, the rest of the markets (Goroka, Banz Kokopo, Lae) collected price data on a monthly basis. No data was collected in the 4th quarter from Mt Hagen market. To access the complete and comprehensive price dataset, you can download it from our website. This bulletin reports the average real monthly fresh food price data from Port Moresby, Goroka, Banz, and Kokopo markets. The prices presented in this report are in real terms, adjusted for inflation using FAO consumer price index (CPI).
Papua New Guinea food price bulletin: October 2023
International Food Policy Research Institute (IFPRI). Washington, DC 2023
Abstract | PDF (210.6 KB)
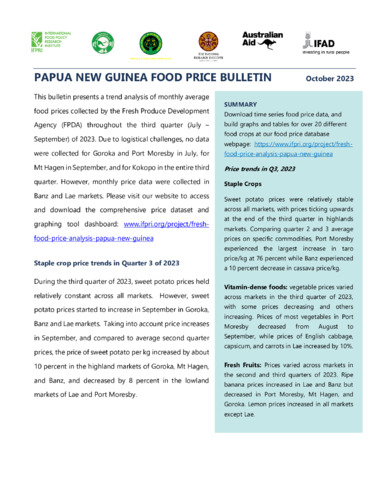
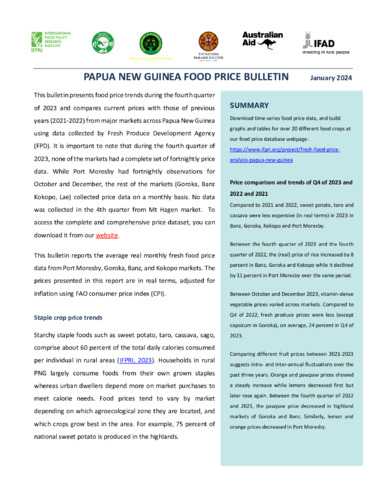
Download time series food price data, and build graphs and tables for over 20 different food crops at our food price database webpage: https://www.ifpri.org/project/fresh food-price-analysis-papua-new-guinea
Price trends in Q3, 2023
Staple Crops: Sweet potato prices were relatively stable across all markets, with prices ticking upwards at the end of the third quarter in highlands markets. Comparing quarter 2 and 3 average prices on specific commodities, Port Moresby experienced the largest increase in taro price/kg at 76 percent while Banz experienced a 10 percent decrease in cassava price/kg.
Vitamin-dense foods: vegetable prices varied across markets in the third quarter of 2023, with some prices decreasing and others increasing. Prices of most vegetables in Port Moresby decreased from August to September, while prices of English cabbage, capsicum, and carrots in Lae increased by 10%.
Fresh Fruits: Prices varied across markets in the second and third quarters of 2023. Ripe banana prices increased in Lae and Banz but decreased in Port Moresby, Mt Hagen, and Goroka. Lemon prices increased in all markets except Lae.
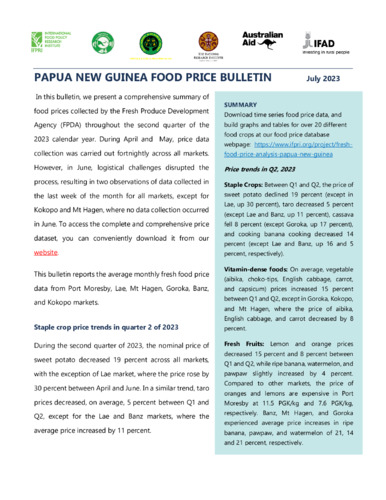
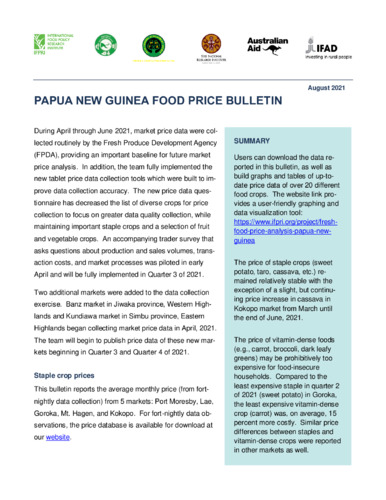
Papua New Guinea food price bulletin: July 2023
International Food Policy Research Institute (IFPRI). Washington, DC 2023
Abstract | PDF
Download time series food price data, and build graphs and tables for over 20 different food crops at our food price database webpage: https://www.ifpri.org/project/freshfood-price-analysis-papua-new-guinea. Price trends in Q2, 2023Staple Crops: Between Q1 and Q2, the price of sweet potato declined 19 percent (except in Lae, up 30 percent), taro decreased 5 percent (except Lae and Banz, up 11 percent), cassava fell 8 percent (except Goroka, up 17 percent), and cooking banana cooking decreased 14 percent (except Lae and Banz, up 16 and 5 percent, respectively). Vitamin-dense foods: On average, vegetable (aibika, choko-tips, English cabbage, carrot, and capsicum) prices increased 15 percent between Q1 and Q2, except in Goroka, Kokopo, and Mt Hagen, where the price of aibika, English cabbage, and carrot decreased by 8 percent. Fresh Fruits: Lemon and orange prices decreased 15 percent and 8 percent between Q1 and Q2, while ripe banana, watermelon, and pawpaw slightly increased by 4 percent. Compared to other markets, the price of oranges and lemons are expensive in Port Moresby at 11.5 PGK/kg and 7.6 PGK/kg, respectively. Banz, Mt Hagen, and Goroka experienced average price increases in ripe banana, pawpaw, and watermelon of 21, 14 and 21 percent, respectively.
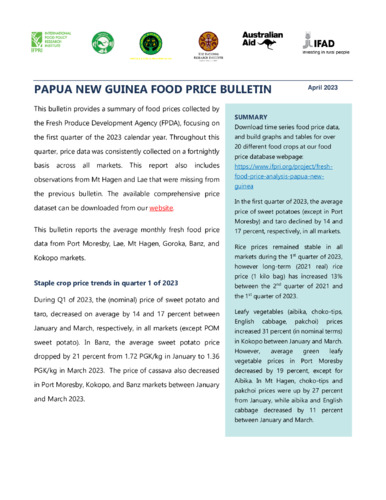
Papua New Guinea food price bulletin: April 2023
International Food Policy Research Institute (IFPRI). Washington, DC 2023
Abstract | PDF (247.2 KB)
Download time series food price data, and build graphs and tables for over 20 different food crops at our food price database webpage: https://www.ifpri.org/project/freshfood-price-analysis-papua-newguinea. In the first quarter of 2023, the average price of sweet potatoes (except in Port Moresby) and taro declined by 14 and 17 percent, respectively, in all markets. Rice prices remained stable in all markets during the 1st quarter of 2023, however long-term (2021 real) rice price (1 kilo bag) has increased 13% between the 2nd quarter of 2021 and the 1st quarter of 2023. Leafy vegetables (aibika, choko-tips, English cabbage, pakchoi) prices increased 31 percent (in nominal terms) in Kokopo between January and March. However, average green leafy vegetable prices in Port Moresby decreased by 19 percent, except for Aibika. In Mt Hagen, choko-tips and pakchoi prices were up by 27 percent from January, while aibika and English cabbage decreased by 11 percent between January and March.
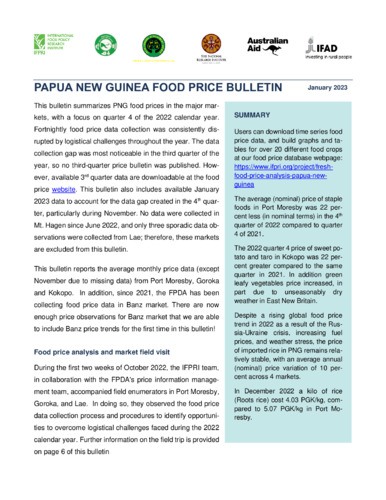
Papua New Guinea food price bulletin: January 2023
International Food Policy Research Institute (IFPRI). Washington, DC 2023
Abstract | PDF (246.9 KB)
Users can download time series food price data, and build graphs and tables for over 20 different food crops at our food price database webpage: https://www.ifpri.org/project/freshfood-price-analysis-papua-newguinea.
The average (nominal) price of staple foods in Port Moresby was 22 percent less (in nominal terms) in the 4th quarter of 2022 compared to quarter 4 of 2021.
The 2022 quarter 4 price of sweet potato and taro in Kokopo was 22 percent greater compared to the same quarter in 2021. In addition green leafy vegetables price increased, in part due to unseasonably dry weather in East New Britain.
Despite a rising global food price trend in 2022 as a result of the Russia-Ukraine crisis, increasing fuel prices, and weather stress, the price of imported rice in PNG remains relatively stable, with an average annual (nominal) price variation of 10 percent across 4 markets.
In December 2022 a kilo of rice (Roots rice) cost 4.03 PGK/kg, compared to 5.07 PGK/kg in Port Moresby.
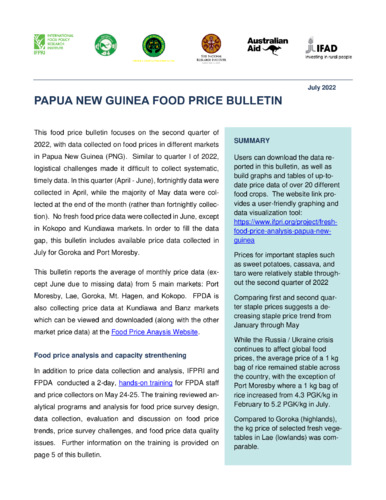
Papua New Guinea food price bulletin: July 2022
International Food Policy Research Institute (IFPRI). Washington, DC 2022
Abstract | PDF (205.1 KB)
This bulletin presents food price data compiled by the International Food Policy Research Institute (IFPRI) and Fresh Produce Development Agency (FPDA) from markets across the country to track food price trends and inform policymakers. In addition, users can access a web-based interactive dashboard for visualizing monthly prices of over 20 different food types over time. Price data collected in 2021 had comparatively higher number of observations compared to the previous year. However, data collection was interrupted in August through mid-September due to logistical challenges and market closures as a result of the COVID-19 surge in PNG, mainly in highland markets, creating gaps in the time series price data.
Papua New Guinea food price bulletin: April 2022
International Food Policy Research Institute (IFPRI). Washington, DC 2022
Abstract | PDF (246 KB)
The per kilo sweet potato (2020 real) price in Port Moresby and Lae in the 1st quarter of 2022 were nearly double the per kilo sweet potato price of the 1st quarter of 2021. The price of cassava and taro held stable in quarter 1 with minimal price changes between January and April across all markets. While, globally, commodity food prices are rising due to supply chain issues and concerns over the Russia-Ukraine conflict, thus far rice prices in PNG remain stable. Vitamin dense fresh vegetables are more costly than staple foods in PNG. However, in Goroka, Mt. Hagen, and Lae, the kg prices of broccoli, carrot and cabbage in the first quarter of 2022 were comparable to taro and cooking banana.
Papua New Guinea food price bulletin: January 2022
International Food Policy Research Institute (IFPRI). Washington, DC 2022
Abstract | PDF (194.7 KB)
This bulletin presents food price data compiled by the International Food Policy Research Institute (IFPRI) and Fresh Produce Development Agency (FPDA) from markets across the country to track food price trends and inform policymakers. In addition, users can access a web-based interactive dashboard for visualizing monthly prices of over 20 different food types over time. Price data collected in 2021 had comparatively higher number of observations compared to the previous year. However, data collection was interrupted in August through mid-September due to logistical challenges and market closures as a result of the COVID-19 surge in PNG, mainly in highland markets, creating gaps in the time series price data.
1 to 10 of 14